Vibrotactile experiences (VTX) consist of a multitude of design parameters and experiential dimensions that can be challenging to communicate visually. To understand how this is commonly done in scientific communication, we systematically reviewed VTX illustrations in academic publications. Using inductive and deductive methods, we built a taxonomy detailing characteristics of VTX illustrations that focuses on what is illustrated and how it is depicted. Using the taxonomy, we coded a total of 768 figures spanning 409 publications. These results indicate that (1) half of the illustrations communicate on the timing of vibrotactile feedback with regards to users’ actions, (2) illustrations depict stimuli rather than experiences and infrequently communicate multimodal aspects of the experiences, and (3) contextual information of vibrotactile displays and experiential aspects are often distributed across several complementary figures. We provide online all the resources we used to draw the conclusions presented in the paper: https://osf.io/vzsyj
2026
HapticsVisualizationTheory
See also bARefoot Squish this Weirding Haptics Tactjam CollabJam
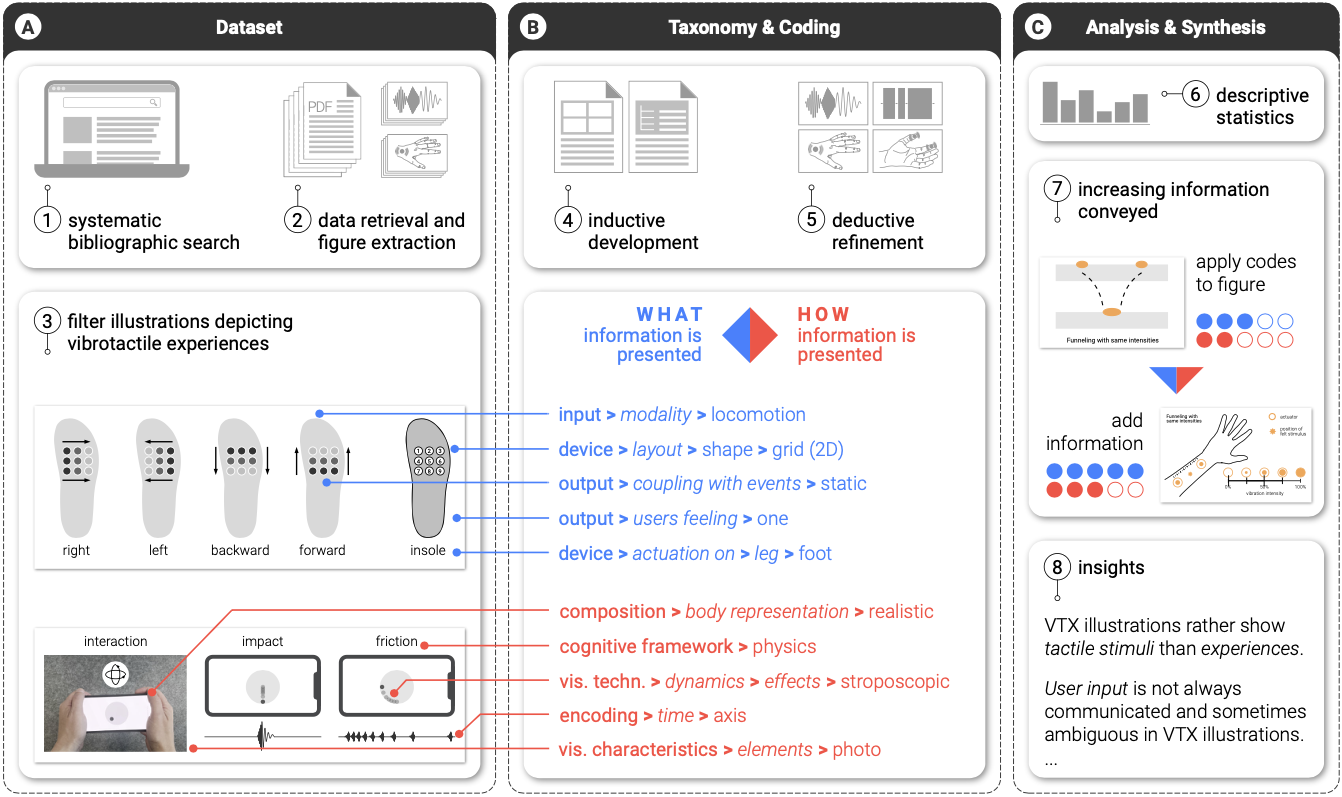
This illustration summarizes the structure of this work. We first collected illustrations of vibrotactile experiences from scientific literature (A), then developed and applied a novel taxonomy of illustration characteristics to code them (B). We furhter analyzed the codes with descriptive statistics and used them to identify potential shortcomings in several illustrations for which we provide more comprehensive alternatives (C). We encourage the readers to take a look at the paper to better grasp the illustrations we analyzed, as we provide examples with consent from authors or publishers.
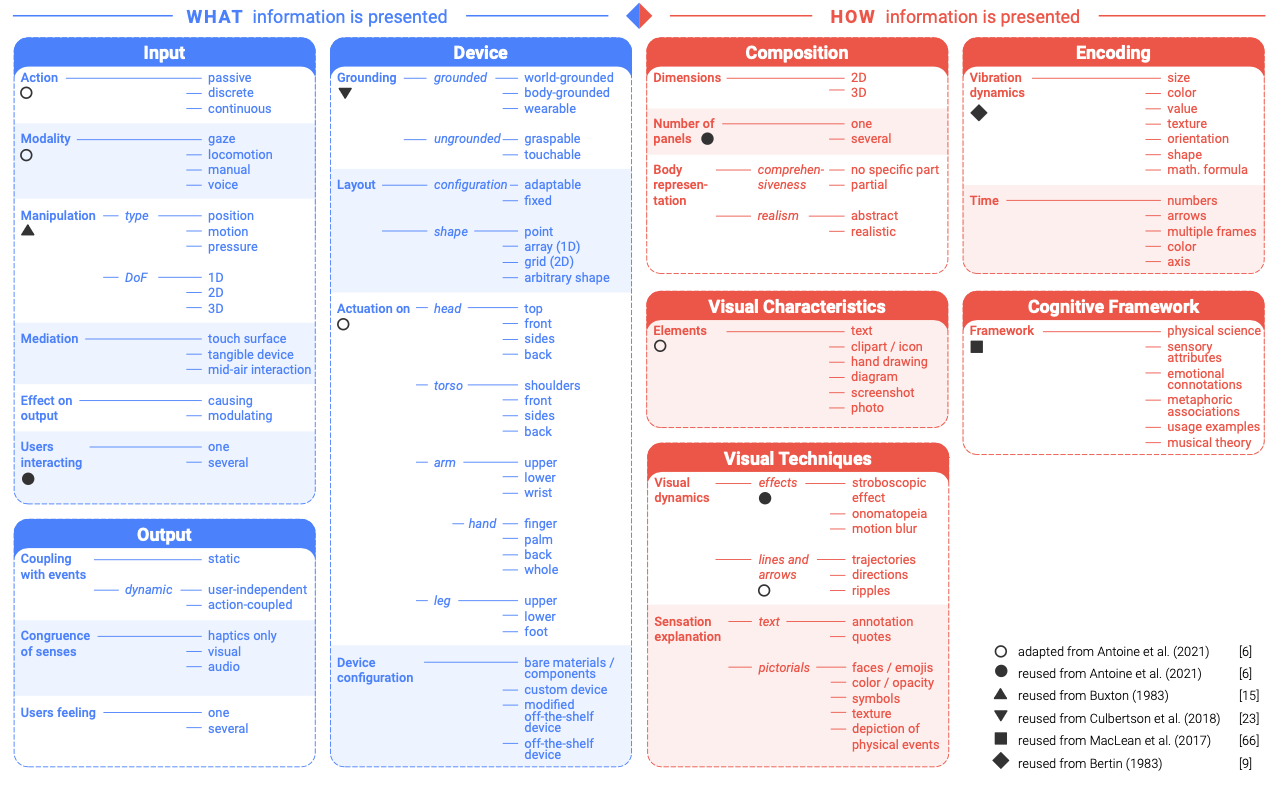
The taxonomy is presented in the image above. It provides two primary categories of codes that indicate what the illustration is representing, and how it is conveying specific bits of information. When reviewing vibrotactile experience illustrations, the analyst can take this taxonomy and simply check each code that is being used by the illustration. While this tool may be difficult to fully grasp at first because of the complexity and sometimes abstraction of several codes, it becomes quite helpful to lead analyses of one's or others' work once mastered. This taxonomy builds on previous work and reuses codes from the following literature: Antoine et al. 2021, Buxton 1983, Culbertson et al. 2018, MacLean et al. 2022 and Bertin's Semiology of Graphics (1983).
Reviewing Illustrations from the Literature
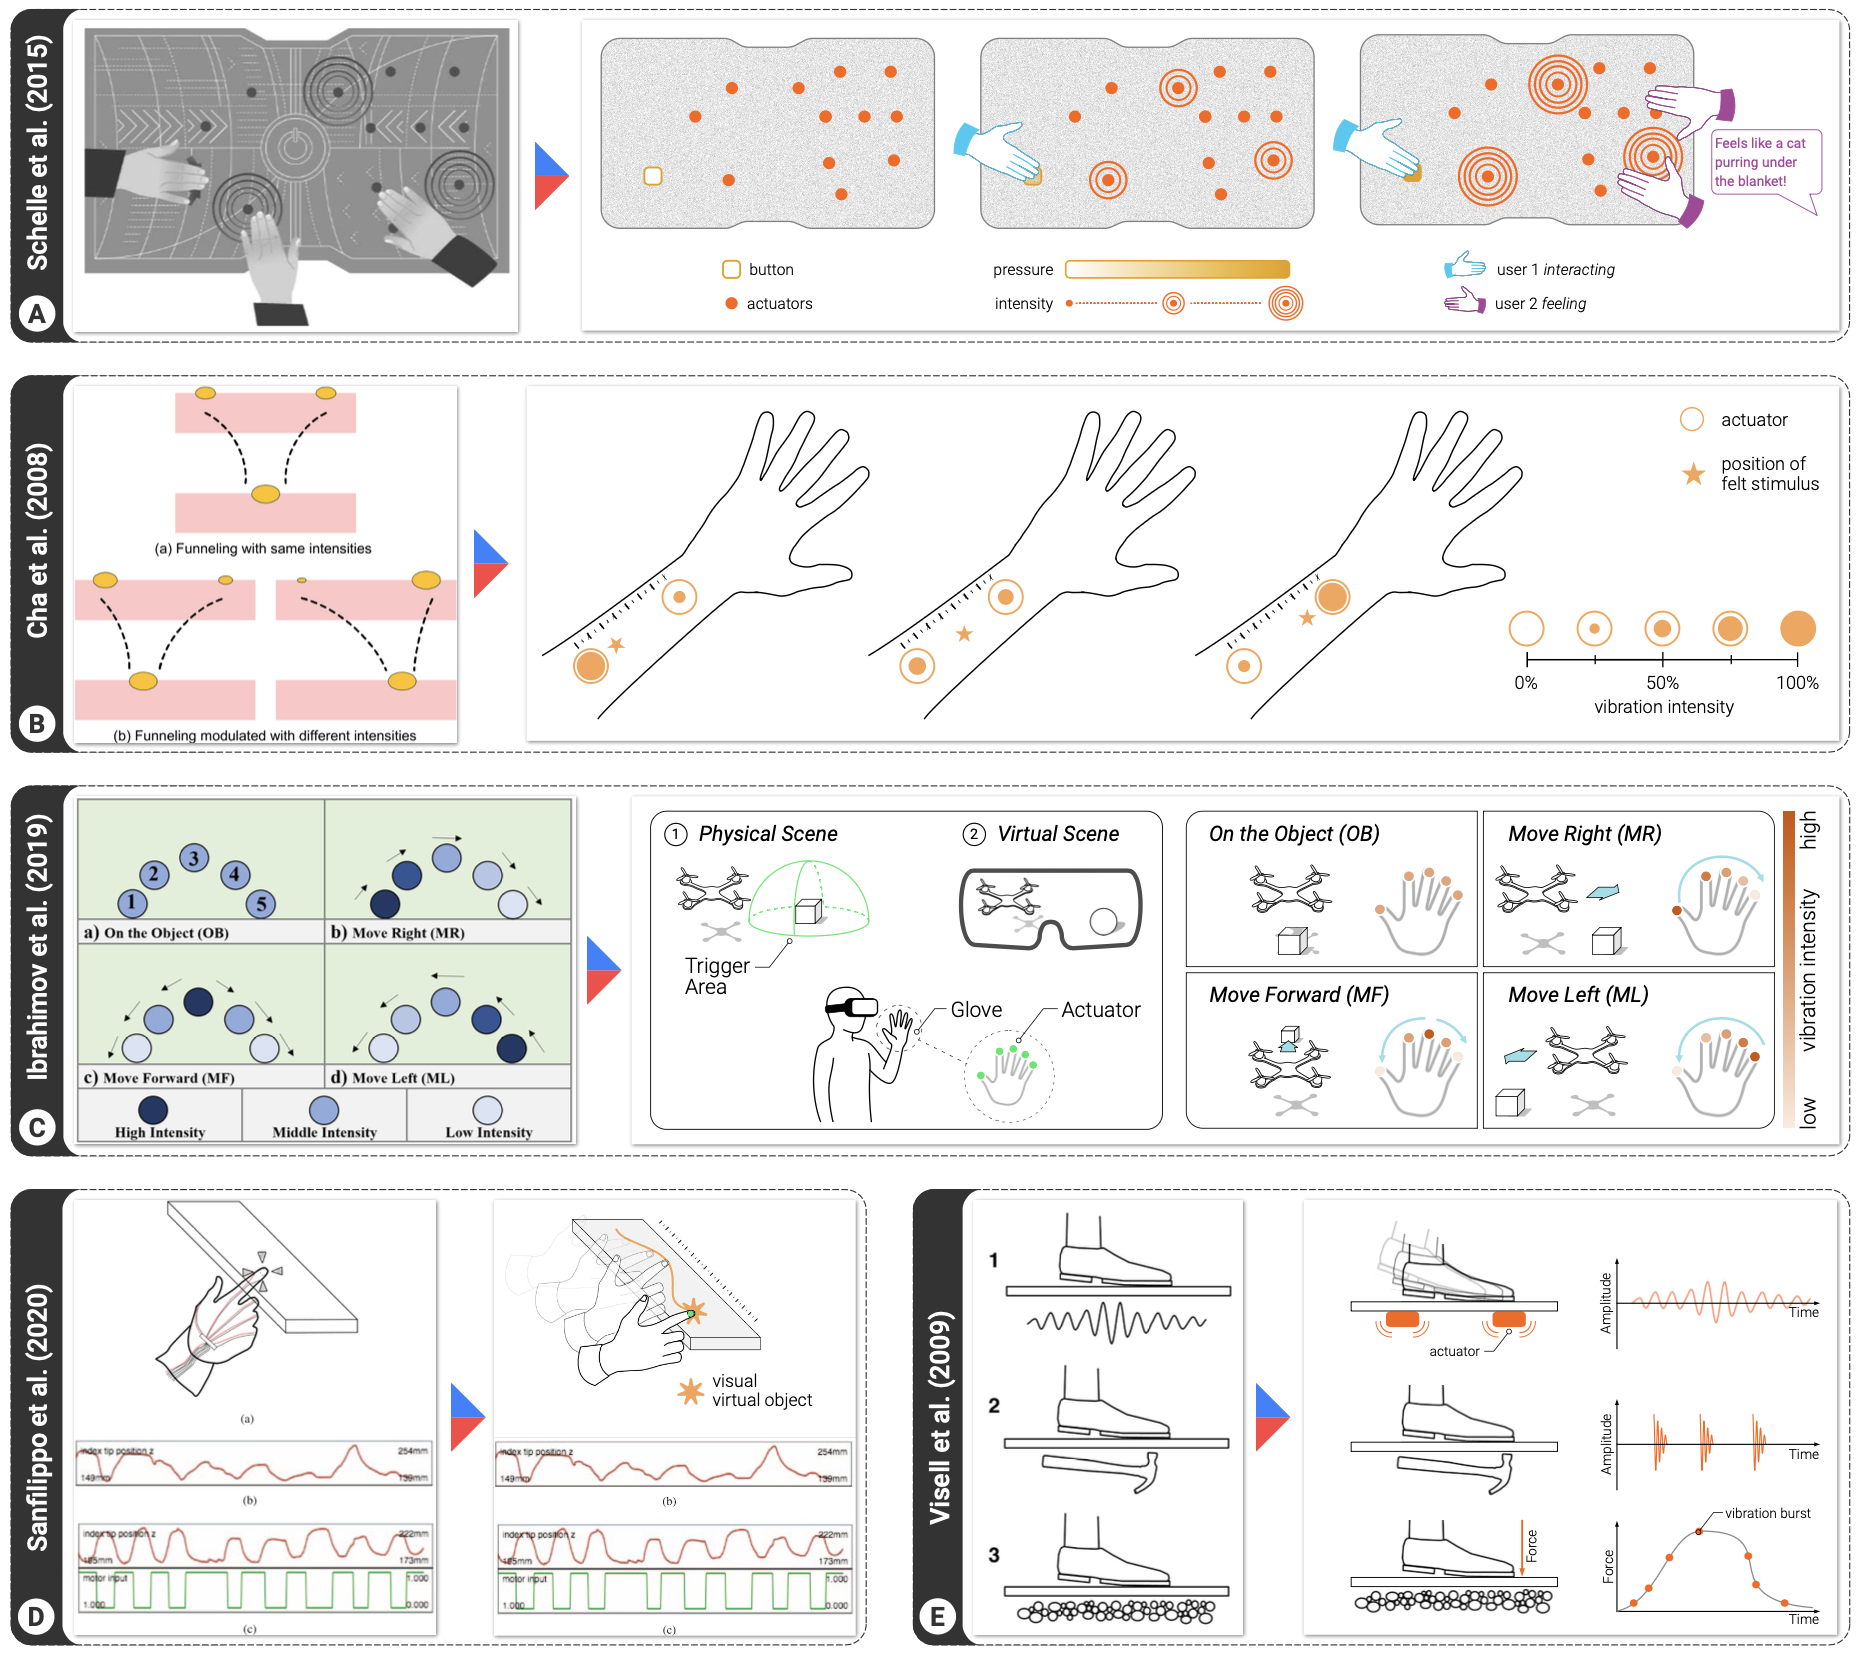
We reviewed five illustrations from the collection in depth by applying codes from the taxonomy and identifying those which could be added to support visual communication. Based on this analysis, we propose variants (see figure below) that convey information on these other categories while preserving VTX authenticity, based on their caption and explanations in the paper. This is just an example of how the taxonomy may support identifying potential information missing in the illustrations to improve them; we do not claim to have created better illustrations with the changes.
Designing VTX with the Taxonomy: a Formative Study
We conducted a formative study to evaluate 1) whether the taxonomy is understandable and usable, and 2) how it supports the design of VTX illustrations. This study included participants with and without experience in haptic design and VTX to assess whether prior knowledge is required to make use of the taxonomy. They were provided with textual prompts describing VTX and asked to illustrate the experience. We used a within-subject design and captured textual data through semi-structured interviews (verbal transcripts). We recruited 11 participants from our institutes and research network with different experience levels in haptics and VTX (7 novices and 4 experienced). Results show that the taxonomy can support designers in reviewing their sketches and reflect on their choices, but not necessarily guide them. The taxonomy can “spark ideas” and “be helpful” to “know your options”, however, participants remarked it did not directly provide guidelines on how to create illustrations from scratch. This was indeed not the goal of this work as we aimed to identify the existence and use of atomic visual characteristics of illustrations, rather than analyzing how efficiently and why they convey specific information.
How are Vibrotactile Experiences Visually Represented? A Taxonomy of Illustration Characteristics Bruno Fruchard, Dennis Wittchen, Nihar Sabnis, Paul Strohmeier, Donald Degraen CHI'26: Proceedings of the ACM SIGCHI Conference on Human Factors in Computing Systems